
Bitcoin trades 32% below its October 2025 record, a milder decline than prior cycles
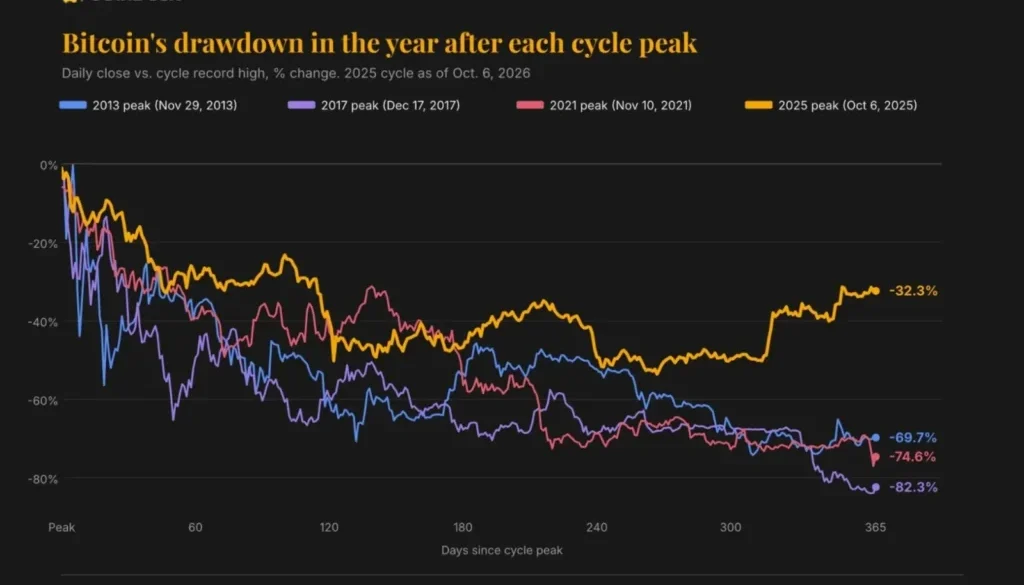
Bitcoin is trading 32% below the record high it set exactly a year ago, a far shallower decline than the 70% to 82% drops that followed its three previous cycle peaks. The milder correction points to a structural shift in who owns bitcoin and how they trade it, from leveraged retail speculation toward steadier institutional ETF flows.
- Bitcoin hit a record above $126,000 on October 6, 2025, and now trades at $85,453, down 32%.
- At its cycle low of roughly $59,000 on June 30, bitcoin was down more than 53% from its peak, versus 77% to 85% drawdowns in past bear markets.
- A single macro-driven sell-off on October 10, 2025 triggered more than $19 billion in crypto derivatives liquidations, clearing out leverage early in the cycle.
- $126,000 bitcoin’s record high set on October 6, 2025
- 32% current decline versus 70-82% after past cycle peaks
- 53% maximum cycle drawdown versus 77-85% historically
- 5.7% 30-year Treasury yield, highest since April 2002
A year ago on October 6, 2025, bitcoin touched an all-time high above $126,000. According to CoinDesk reported, the token now trades at $85,453, a 32% retreat that would rattle traditional markets but looks mild by bitcoin’s own history.
After the 2013 peak, bitcoin was down 69.7% a year later. Following the December 2017 top it was down 82.3%, and a year after the November 2021 high it had fallen 74.6%, per CoinDesk’s calculations.
Bitcoin’s 32% drop dwarfed by prior cycle declines of up to 82%
The shallower anniversary figure matches a milder bear market overall. Bitcoin’s low point came just below $59,000 on June 30, a drawdown of just over 53% from the peak, compared with declines of 77% to 85% in earlier cycles. The trough also arrived roughly nine months after the top this cycle, earlier than in past downturns where the bottom often landed around the one-year mark or later.
Tim Sun, senior researcher at HashKey Group, told CoinDesk the compressed timeline is the defining feature of this cycle.
The most notable changes are the significantly shortened duration of the drawdown and the reduced time spent at the bottom.
Tim Sun, senior researcher, HashKey Group
Sun attributed the shift to who is buying. Retail traders and leverage drove prior bull runs that ended in crashes and exchange failures, as seen in 2022, while the 2023 to 2025 uptrend was powered by institutional inflows through ETFs, asset managers, family offices and corporations.
$19 billion liquidation event unwound leverage in a single day
Most of the cycle’s leverage was cleared out on October 10, 2025, when a macro-driven sell-off triggered more than $19 billion in crypto derivatives liquidations. Temporary pricing deviations on Binance for tokens including USDe, wBETH and BNSOL added to the stress as exchanges’ auto-deleveraging mechanisms forcibly closed profitable positions.
Griffin Ardern, co-founder and volatility desk portfolio manager at Primal Fund, said institutional ETF flows behave differently from retail speculation because allocation money rebalances toward target weights rather than chasing momentum. With leverage largely gone after the October selloff and never fully rebuilt, Ardern said the market took nine months to grind out a 53% decline rather than collapsing 80% in a few months of cascading liquidations.
Bitcoin’s annualized volatility now hovers around 40%, Sun said, well below its long-term historical levels above 80%. Ardern pointed to similar compression in the options market, where bitcoin’s DVOL implied-volatility index has been pinned around 35 points, describing the likely path forward as a staircase pattern of gradual gains, air pockets and fast repairs rather than a parabolic run.
30-year Treasury yield at 5.7% could determine bitcoin’s next move
Sun has not ruled out sharp rallies, pointing to bitcoin’s capped 21 million supply and heavy concentration among long-term holders. Large ETF inflows, a rapid improvement in macro liquidity or concentrated short covering could still produce what he called non-linear surges in price.
Ardern’s bigger concern is positioning rather than price. Implied volatility sits near its lowest percentile on record and one-year options skew remains neutral to bearish, meaning traders are not yet paying up for upside exposure even as they accept the shallow-drawdown narrative.
Ardern tied the next move to the bond market rather than bitcoin’s own chart. The 30-year Treasury yield recently hit 5.7%, its highest level since April 2002, and has climbed more than 80 basis points this year, raising the opportunity cost of holding non-yielding assets like bitcoin and gold. The Treasury announced an expanded bond buyback program in August to slow the rise in yields, and bitcoin rallied from roughly $64,000 to nearly $80,000 in the days that followed, though yields have continued climbing since. Ardern compared current conditions to the Nasdaq between 1994 and 1999, when slowing policy stretched the cycle and every interim correction stayed shallow, a run that ended with the index losing nearly 78% over roughly two years after its March 2000 peak.
The BlockWest read. The real signal for allocators is not bitcoin’s drawdown math but the derivatives positioning Ardern describes: cheap downside protection and unpaid-for upside exposure. For corporate treasuries and ETF-linked funds now holding meaningful bitcoin allocations, the 30-year yield, not bitcoin’s own chart, has become the variable worth hedging against before any rebalancing decision.
Ardern’s warning centers on the long end of the Treasury curve. If the 30-year yield’s recent defense near 5.7% continues failing, he said this cycle’s shallow drawdowns may not hold, leaving open whether bitcoin’s next move tracks fiscal stress in Washington rather than crypto-specific demand.
BlockWest is a news publication. Nothing here is investment advice. Read our disclaimer and editorial policy.